

TECHNICAL ANALYSIS
Technical analysis is a trading discipline employed to evaluate investments and identify trading opportunities in price trends and patterns seen on charts. Technical analysts believe past trading activity and price changes of a security can be valuable indicators of the security's future price movements
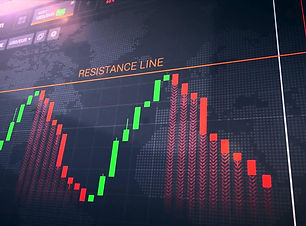
Support and Resistance
“Support and resistance” is one of the most widely used concepts in trading.
Strangely enough, everyone seems to have their own idea of how you should measure support and resistance

Fibonacci
Fibonacci retracement levels are horizontal lines that indicate the possible locations of support and resistance levels. Each level is associated with one of the above ratios or percentages. It shows how much of a prior move the price has retraced. The direction of the previous trend is likely to continue
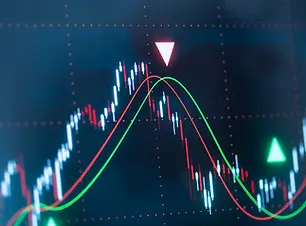
Moving Averages
A moving average is a stock indicator commonly used in technical analysis, used to help smooth out price data by creating a constantly updated average price. A rising moving average indicates that the security is in an uptrend, while a declining moving average indicates a downtrend
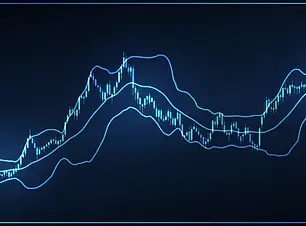
Bollinger Bands
Bollinger bands help determine whether prices are high or low on a relative basis. They are used in pairs, both upper and lower bands and in conjunction with a moving average. Further, the pair of bands is not intended to be used on its own. Use the pair to confirm signals given with other indicators

Parabolic SAR
The parabolic SAR is a technical indicator used to determine the price direction of an asset, as well as draw attention to when the price direction is changing. Sometimes known as the "stop and reversal system," the parabolic SAR was developed by J. Welles Wilder Jr., creator of the relative strength index (RSI)

RSI (Relative Strength Index)
The basic idea behind the RSI is to measure how quickly traders are bidding the price of the security up or down. The RSI plots this result on a scale of 0 to 100. Readings below 30 generally indicate that the stock is oversold, while readings above 70 indicate that it is overbought.

ADX (Average Directional Index)
The average directional index (ADX) is a technical analysis indicator used by some traders to determine the strength of a trend. The trend can be either up or down, and this is shown by two accompanying indicators, the negative directional indicator (-DI) and the positive directional indicator (+DI).

Ichimoku Kinko Hyo
Ichimoku Kinko Hyo (IKH) is an indicator that gauges future price momentum and determines future areas of support and resistance
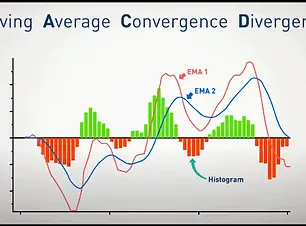
MACD
The moving average convergence/divergence (MACD, or MAC-D) line is calculated by subtracting the 26-period exponential moving average (EMA) from the 12-period EMA. The signal line is a nine-period EMA of the MACD line. MACD is best used with daily periods